
2016 showed significant growth for Finnish ecommerce. The industry has moved in a more professional direction and those in the ecommerce industry are strongly networked. These factors among other things have fueled a high rate of growth for Finnish ecommerce. In the below ecommerce statistics, you can see the 2016 figures.
Finnish ecommerce grew by 40% in 2016
emarketer.com reported that globally ecommerce increased 6% in 2016. This is not directly proportional to our data, but does give an indication even when interpreted conservatively, that the growth of Finnish ecommerce was above average in 2016.
Our data shows that Finnish ecommerce overall increased 40% from the previous year, compared to the previous year’s growth of 36%. The growth rate has accelerated.
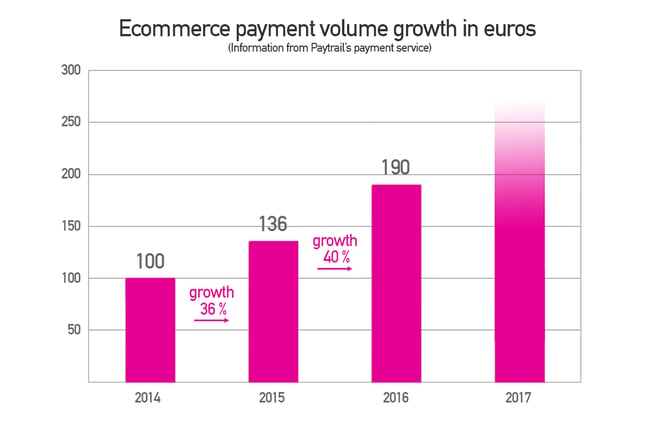
The figures have been converted into comparative figures so that the payment volume of 2014 in euros forms the index of 100 for the basic benchmark date.
The best and worst sales days of 2016
TOP 5 ONLINE SALES DAYS
The top 5 sales days of 2016 were mostly in November.
- 25.11. (Black Friday)
- 29.11. (Tax refund day)
- 9.12.
- 15.8.
- 1.8.
The very best online sales day of 2016 was Black Friday 25.11. Apart from Black Friday and the tax refund day, other super sales days didn’t make it into the five busiest days. Cyber Monday (28.11.) dropped to 8th place and the biggest sales day of 2015, the Monday after tax refund day (5.12.), dropped to 11th place.
THE QUIETEST ONLINE SALES DAYS
The top 5 quietest sales days of the year were as follows:
- 25.6. (Midsummer’s day)
- 24.12. (Christmas eve)
- 24.6. (Midsummer’s eve)
- 26.3. (Day before Easter)
- 21.5.
The quietest online sales days were mostly on or around different holidays. Finns don’t shop online during the holidays.
Average purchase
The average purchase increased by 9% in 2016. This indicates a slight increase in purchasing power. In 2015, the average purchase grew by less than half a percent.
| Year | Average purchase amount |
| 2014 | 73.067 € |
| 2015 | 73.321 € |
| 2016 | 80.048 € |
Slow changes in the payment method distribution
The Finnish consumer still prefers to pay by online bank when making online purchases. Even though banks have a strong role in the payment method distribution, a small shift in card payments can be seen. Likewise, the use of invoices has increased slightly, although overall their share is still quite small. Preferences still are vastly divided.
| Year | Banks | Cards | Invoice |
| 2014 | 91,5% | 7,3% | 1,2% |
| 2015 | 90,9% | 8,2% | 0,9% |
| 2016 | 89,86% | 8,74% | 1,4% |